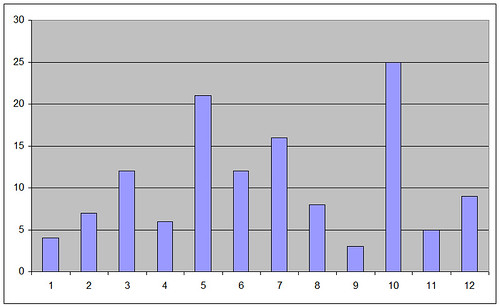
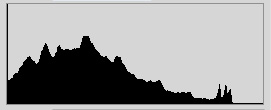
You're in a room with a bunch of pixels, and you ask what their gray values are. 0 is black, 255 is white, and all the grays in between. So you make another bar graph. Except this time the bars are thin, and there are no gaps between them or the graph will go off the screen.
No, they didn't invent this for digital photography :)
(Color histograms slightly more complicated, but that's another blog post...)
What a great way to look at it!
ReplyDelete